In This Article
One page can hold different kinds of numbers
PIF's 2025 annual-report page presents assets under management, net profit, cumulative domestic investment and economic contributions. Those measures describe different aspects of the institution. They should not be added together or treated as interchangeable forms of return.
A company dashboard can face the same problem at a smaller scale. Revenue, cash received, order intake and pipeline may all be relevant, but they answer different questions. This article proposes a definition sheet to keep the distinction clear; it is not an assessment of any company's performance.
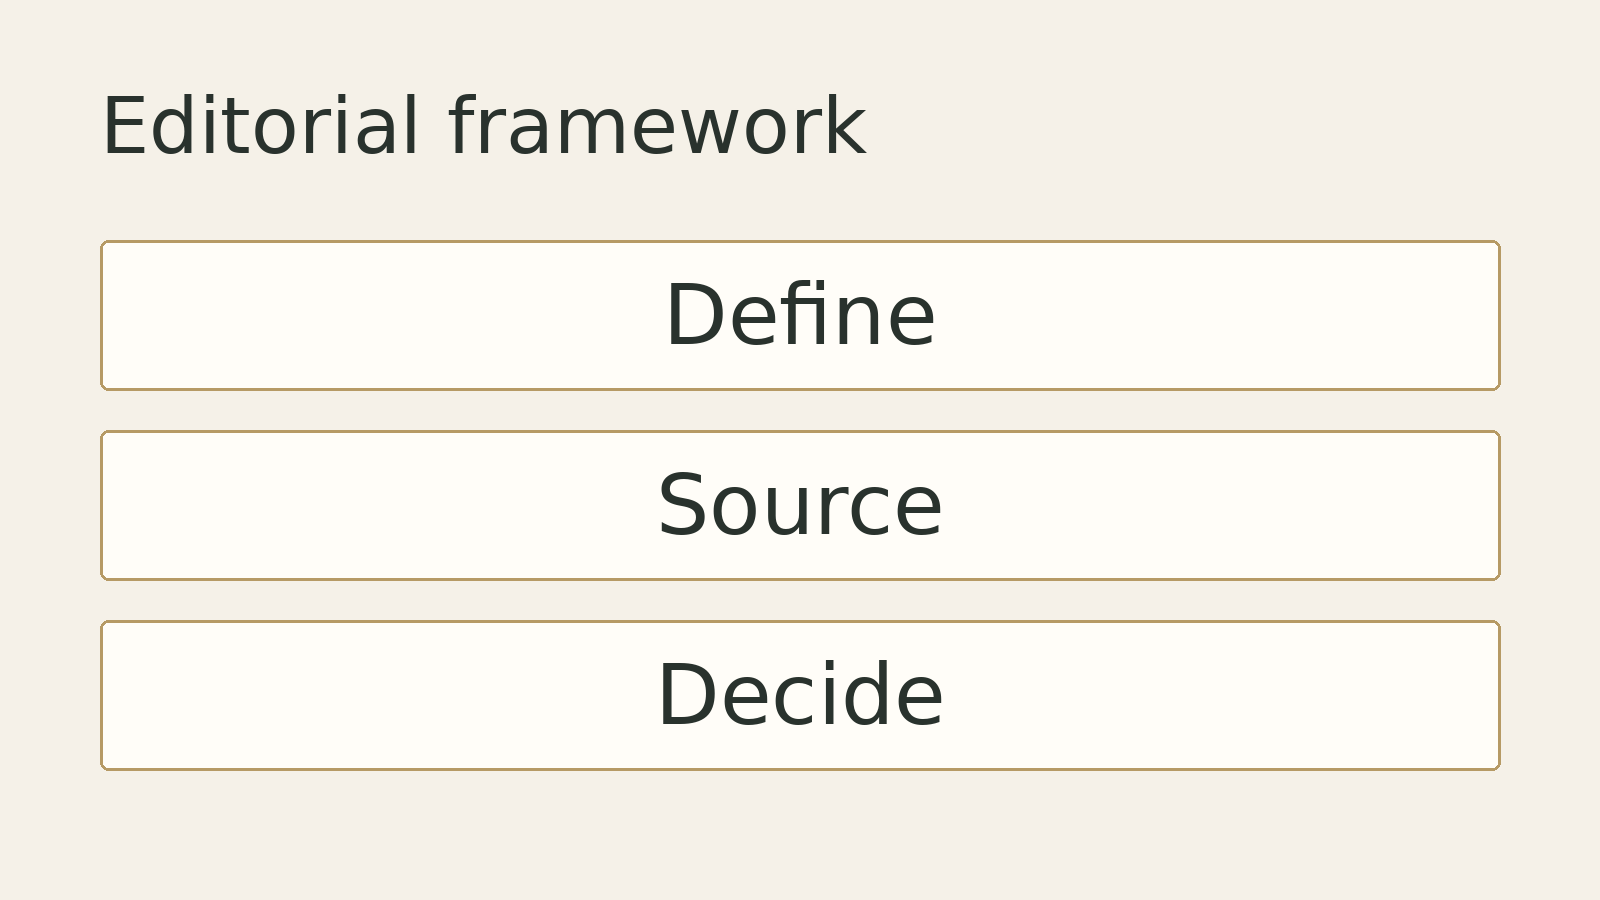
Define the metric before debating the target
For each metric, record its name, unit, reporting period, scope, calculation and source. State whether it is an actual result, a forecast, a target or a scenario. Identify which entity or business unit it covers and whether the number is gross, net or otherwise adjusted.
Give someone responsibility for maintaining the definition. A familiar label can drift when a team changes its system or reporting process. If the definition changes, explain the change and its effect on comparisons instead of silently placing the new series beside the old one.
Ask what the number leaves out
A sales total may not show collection timing. A project pipeline may contain stages with very different certainty. A cumulative impact figure cannot be read as a one-year result without checking its period. The useful follow-up is specific to the metric, not a generic request for more detail.
Choose a small set of questions that expose the decision being made. What action would follow a change in this number? Which other measure would test the interpretation? What information is missing? A dashboard does not become better simply by adding more charts.
Keep the source trail available
Link the presentation to the underlying approved record and note when it was prepared. Keep material caveats next to the figure, especially when data is provisional or coverage differs. Someone joining the discussion should be able to recover the basis without relying on a private explanation.
The annual-report example illustrates why scope and period matter. The proposed management response is straightforward: define each measure, preserve its boundary and connect it to a real decision. A shorter dashboard with checkable numbers can support a better discussion than a dense page whose labels conceal different meanings.
Sources and scope
This is an editorial working method, not legal or tax advice. The linked sources supply the context; the suggested checklists are our analysis. International evidence is not presented as Middle East survey data or universal law. Confirm requirements for the specific entity with qualified advisers where relevant.